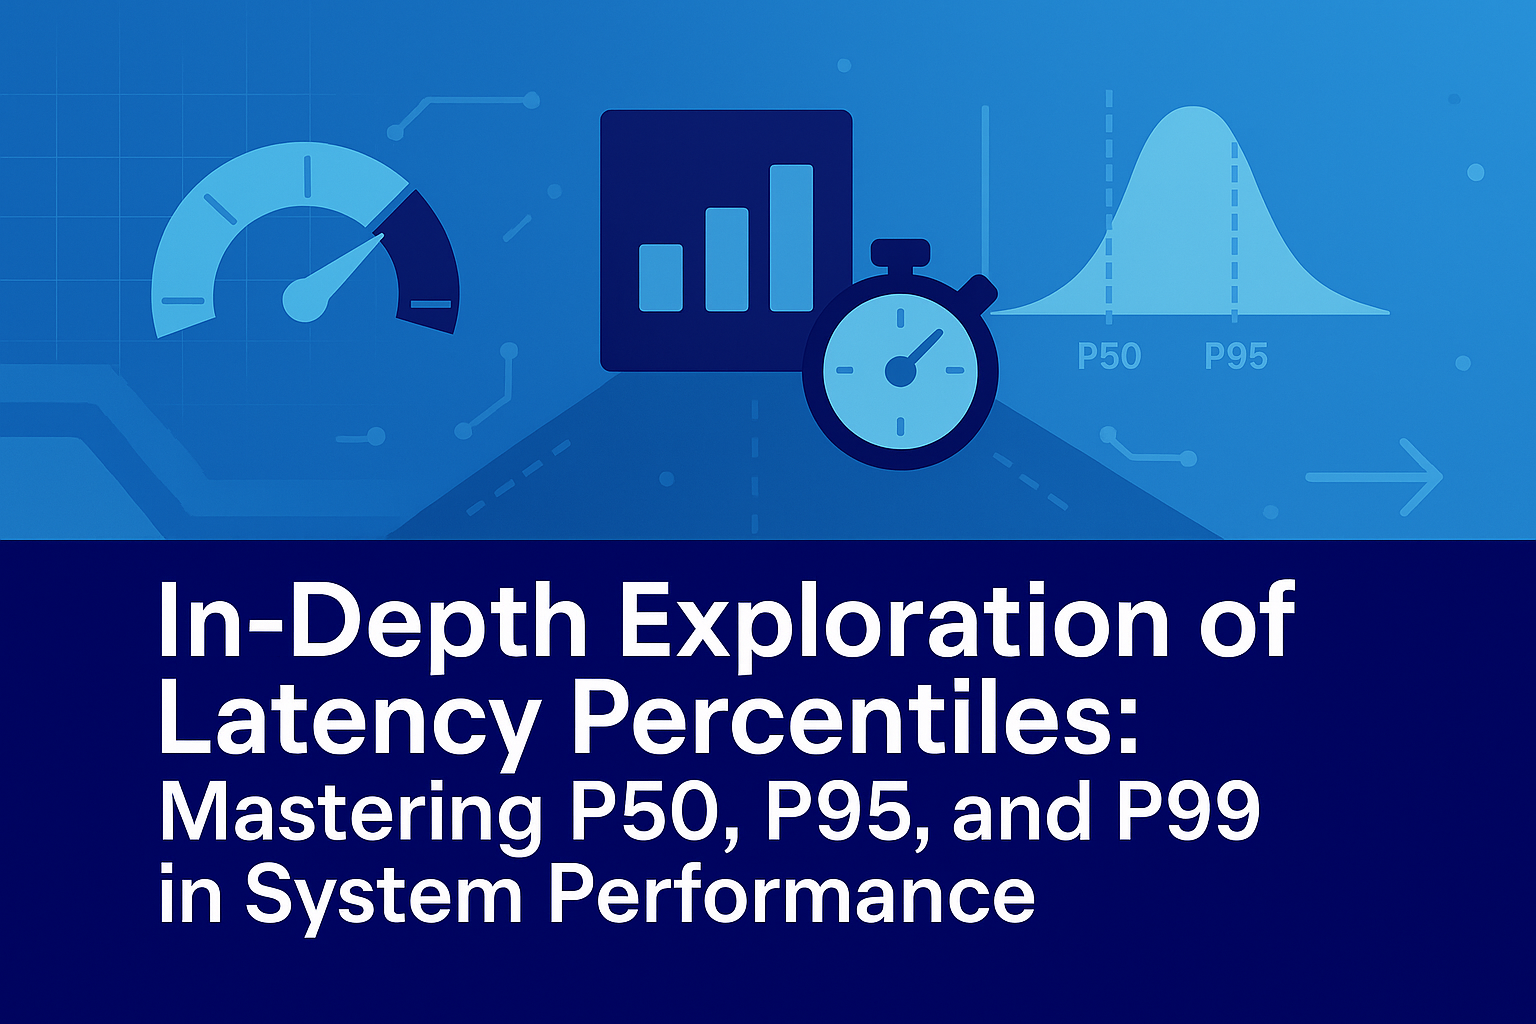
Latency percentiles, including P50, P95, and P99, are fundamental metrics in the domains of performance engineering, site reliability engineering (SRE), and distributed systems monitoring. This expanded guide delves deeper into these concepts, elucidating their advantages over traditional averages in handling skewed data distributions. It covers implications for end-user experiences, methodologies for defining robust service level objectives (SLOs), and advanced techniques for data aggregation and analysis. Particular emphasis is placed on practical implementation within .NET Core environments using C#, including code examples leveraging OpenTelemetry for instrumentation. By incorporating these percentiles, developers and engineers can achieve a more granular understanding of system dynamics, facilitating proactive optimizations that bolster reliability and efficiency.
Core Concepts and Detailed Definitions
To establish a solid foundation, consider the following detailed definitions of key latency percentiles, along with their operational relevance:
- P50 (Median Latency): This metric identifies the latency value below which 50% of all requests are completed. It effectively captures the “typical” user experience, as it balances the dataset by ensuring an equal number of requests fall above and below this threshold. In practice, P50 is resilient to extreme outliers, making it a reliable indicator for everyday performance.
- P95 Latency: Representing the 95th percentile, this value denotes the latency under which 95% of requests are processed. It acts as a sentinel for early tail latency issues, where the remaining 5% of requests may indicate budding inefficiencies, such as intermittent resource contention or partial overloads, that could escalate if unaddressed.
- P99 Latency: As the 99th percentile, P99 highlights the latency threshold for 99% of requests, isolating the worst 1% of experiences. This is especially pertinent in mission-critical contexts, including e-commerce transaction processing, administrative dashboards, or APIs subjected to variable loads, where delays in this tail can lead to substantial revenue loss or user dissatisfaction.
- Average (Mean) Latency: Although straightforward, the mean is often inadequate for latency analysis due to its susceptibility to skewness from outliers. It should not serve as the primary service level indicator (SLI), as it can mask underlying distribution characteristics.
Strategically, P50 is utilized for monitoring general regressions, P95 for iterative performance refinements, and P99 for diagnosing profound architectural limitations or sporadic anomalies. Notably, targeting P100—the maximum latency observed—is generally unproductive, as it frequently arises from non-reproducible noise, such as transient network failures, rather than indicative patterns.
Limitations of Average Latency in Depth
The reliance on average latency is problematic because real-world latency distributions are seldom Gaussian; instead, they exhibit pronounced long tails. These tails are driven by infrequent but impactful events, including garbage collection cycles in managed runtimes like .NET’s CLR, container cold starts in cloud environments, exponential backoff retries, transient network latencies, or mutex lock contentions in multi-threaded applications.
To illustrate with an expanded example involving 10,000 requests:
- 9,400 requests complete in 50 milliseconds (ms), representing the bulk of efficient operations.
- 500 requests complete in 120 ms, possibly due to minor caching misses.
- 90 requests complete in 600 ms, stemming from database query delays.
- 10 requests complete in 8,000 ms, caused by rare events like full garbage collection or external API timeouts.
The mean latency computes to approximately 118 ms, portraying a misleadingly pessimistic view of system health. Conversely, the P50 remains at 50 ms, affirming that the majority of users enjoy responsive interactions. The P95 approximates 120–130 ms, and P99 nears 600 ms. Blind optimization toward the mean might divert resources toward isolated incidents, overlooking repeatable tail behaviors that percentiles adeptly reveal. In .NET Core applications, such skewness is common in ASP.NET Core web APIs, where asynchronous I/O operations can amplify tail effects under load.
Mathematical Foundations of Percentiles
A percentile, exemplified by P95, precisely means that 95% of requests have latencies at or below this value. It is not a claim that 95% cluster exactly at this point but rather a positional threshold in the ordered dataset.
Computationally, after sorting latencies in ascending order, the Pth percentile is the value at the index floor((P/100) * N), where N is the sample size (with adjustments for one-based indexing in some implementations). This method provides a statistically robust view, insensitive to distribution shape, which underpins its adoption in SRE practices, capacity forecasting, and bottleneck identification. For large datasets in .NET, libraries like MathNet.Numerics can assist in percentile calculations, though for real-time monitoring, histogram-based approximations are preferred to handle streaming data efficiently.
Interpretive Framework for Percentiles with Expanded Use Cases
Percentiles can be systematically interpreted through the following expanded framework, incorporating additional percentiles for nuanced analysis:
- P50: Establishes baseline system vitality and median user perception. It excels in spotting deployment-induced regressions, such as those from updated NuGet packages in .NET Core.
- P75 (Optional Extension): Probes the initial mid-tail, aiding evaluations of interactive elements like UI rendering smoothness or incremental data loads in web applications.
- P90/P95: Manages broader tail latencies, informing secondary alerting thresholds and tuning efforts, such as optimizing connection pools in Entity Framework Core.
- P99: Scrutinizes severe tail scenarios, supporting SLO formulations, outlier forensics, and redesigns, like refactoring synchronous code to async/await patterns.
- P99.9: Applies to hypersensitive domains, including financial trading platforms or real-time multiplayer gaming, where sub-millisecond variances matter.
In most .NET Core scenarios, such as RESTful services or microservices architectures, limiting analysis to P99 suffices unless ultra-low latency is a core requirement.
Guidelines for Integrating Percentiles into SLOs
Crafting SLOs demands alignment with service type and stakeholder expectations:
- For external-facing .NET Core web APIs or Blazor applications, pair availability SLOs with P95 latency targets (e.g., 95% of authentication requests under 300 ms), supplemented by P99 oversight.
- Internal services, like background workers using Hangfire, may emphasize P95 for consumption stability and P99 for anomaly detection.
- Interactive UIs benefit from P75 for perceived responsiveness (e.g., first contentful paint) and P95 for full interactions, such as in Razor Pages.
- Asynchronous tasks, like message queue processing with RabbitMQ, prioritize throughput and error rates over percentiles.
Initiate with monitoring rather than rigid enforcement of P95 and P99 to mitigate alert overload, escalating to policy only post-stabilization. In .NET ecosystems, tools like Application Insights can automate SLO tracking.
Diagnosing Architectural Issues via Percentile Patterns
Percentile anomalies often correlate with specific root causes, expanded here with .NET-specific actions:
- Abrupt P50 elevation: Likely a code deployment or appsettings.json change; respond with rollback or git bisect.
- Unchanging P50 but escalating P95: Indicates thread pool exhaustion or load imbalances; scale via Azure App Service or tune HttpClient instances.
- Stable P95 with P99 surges: Points to .NET GC pauses or container orchestration issues; optimize with GC.Collect tuning or pod pre-warming in Kubernetes.
- Persistent P99 ceilings: Suggests downstream service blocks; implement HttpClient timeouts or Circuit Breaker patterns with Polly.
- Synchronous percentile increases: Signals resource saturation; profile with dotnet-trace and scale horizontally.
- Gradual P99 drift: Arises from memory leaks or queue overflows; enforce Dispose patterns and periodic restarts.
Advanced Alerting Approaches
Effective alerting requires nuance to prevent fatigue:
- Anchor primary SLOs on P95 with multi-window burn-rate models.
- Route P99 deviations to analytical dashboards for sustained review.
- Employ relational alerts, e.g., P99 > 4 × P50 over 10 minutes, to highlight divergences.
- Integrate with complementary metrics like HTTP error rates and CPU/memory saturation before notifications.
In .NET, leverage Serilog for logging correlations.
Robust Techniques for Percentile Aggregation
Eschew naive methods like in-memory storage of all latencies or aggregating means, as they incur high costs and introduce errors. Favor probabilistic structures:
- HDR Histograms for high-fidelity quantiles.
- t-digest for composable approximations.
- OpenTelemetry histograms for standardized instrumentation.
For .NET Core, integrate OpenTelemetry in an ASP.NET Core application as follows:
using Microsoft.AspNetCore.Builder;
using Microsoft.AspNetCore.Hosting;
using Microsoft.Extensions.DependencyInjection;
using Microsoft.Extensions.Hosting;
using OpenTelemetry.Metrics;
using OpenTelemetry.Resources;
using OpenTelemetry.Exporter;
using System.Diagnostics.Metrics;
using System;

var builder = WebApplication.CreateBuilder(args);

// Configure OpenTelemetry Metrics
builder.Services.AddOpenTelemetry()
    .WithMetrics(metrics =>
    {
        metrics.AddAspNetCoreInstrumentation(); // Automatically instruments ASP.NET Core requests
        metrics.AddMeter("CheckoutService"); // Custom meter for application-specific metrics
        metrics.AddOtlpExporter(exporterOptions =>
        {
            exporterOptions.Endpoint = new Uri("https://telemetry.your-backend.example/v1/metrics");
        });
    });

var app = builder.Build();

// Custom histogram for request latency
var meter = new Meter("CheckoutService");
var requestLatency = meter.CreateHistogram<double>("http.server.request.duration",
    unit: "ms",
    description: "Measures the duration of inbound requests.");

// Middleware for manual instrumentation (if needed beyond auto-instrumentation)
app.Use(async (context, next) =>
{
    var start = DateTimeOffset.UtcNow;
    try
    {
        await next();
    }
    finally
    {
        var duration = (DateTimeOffset.UtcNow - start).TotalMilliseconds;
        var attributes = new KeyValuePair<string, object?>[]
        {
            new("http.route", context.Request.Path),
            new("http.method", context.Request.Method),
            new("http.status_code", context.Response.StatusCode)
        };
        requestLatency.Record(duration, attributes);
    }
});

app.MapGet("/", async context =>
{
    // Business logic here
    await context.Response.WriteAsync("OK");
});

app.Run();This configuration enables backend computation of P50/P95/P99 from histogram buckets, filtered by attributes like route or status.
Challenges in Optimizing P99 Latency
P99 improvements are arduous due to their exposure of elusive frictions:
- Serverless cold starts in Azure Functions.
- .NET JIT compilation overheads.
- Cache evictions reverting to slower SQL queries via EF Core.
- Thread synchronization bottlenecks.
- Coordinated GC in multi-core environments.
- Retry avalanches post-transients.
Solutions often entail architectural shifts, such as dependency injection for warm instances, sharding, multi-level caching, task parallelism, or adaptive backoffs with ExponentialBackoffRetry.
Incorporating Percentiles into Error Budget Frameworks
Define latency SLOs as, e.g., “95% of API calls under 300 ms monthly.” The 5% allowance forms the latency error budget; rapid depletion triggers performance prioritization over new features. Harmonize with availability budgets for holistic reliability in .NET deployments.
Enhanced Tooling Recommendations
- Unify observability in platforms like Azure Monitor for integrated traces, metrics, and SLOs.
- Store latencies as histograms to preserve distributional integrity.
- Restrict metric tags to essentials (e.g., HTTP method, endpoint, status) to control cardinality.
- Contextualize percentiles with concurrent request counts, as low-volume P99 lacks significance.
- Overlay deployment annotations for temporal correlations.
Comprehensive Dashboard Design for Latency Insights
A well-architected dashboard comprises:
- Time-series of request throughput.
- Overlaid P50/P95/P99 charts with uniform scaling.
- Adjacent panels for error rates and resource metrics.
- Latency distribution heatmaps.
- Linked slow-request traces.
- Event markers for releases.
This facilitates rapid diagnostics in .NET environments.
Final Synthesis
Latency percentiles furnish a distribution-centric vantage, surpassing averages in fidelity. Employ P50 for normative assessments, P95 for tail governance, and P99 for inefficiency eradication. Instrument via histograms in .NET Core, alert on SLO dynamics, and refine iteratively based on empirical impacts. True reliability in .NET systems emerges from engineering resilience against tail variances, ensuring optimal experiences across user spectra.


